Database of RNA Tree Graphs
List of RNA Tree Graphs by Number of Vertices:
2 3 4 5 6 7 8 9 10 11 12 13
Number of Possible RNA Topologies: 47
Number of Motifs Found: 9
Number of Missing Motifs: 38
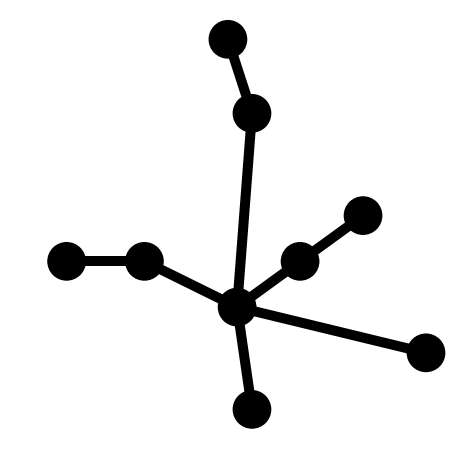
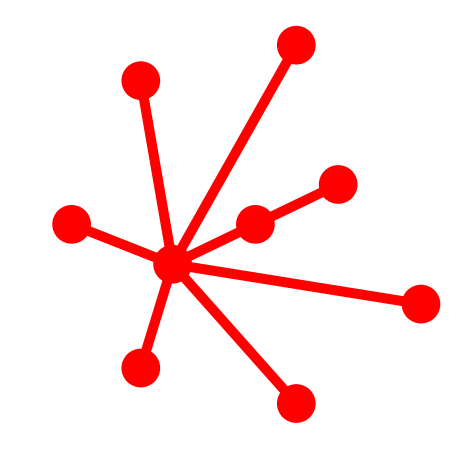
To learn more about an RNA topology, please click on its tree graph.
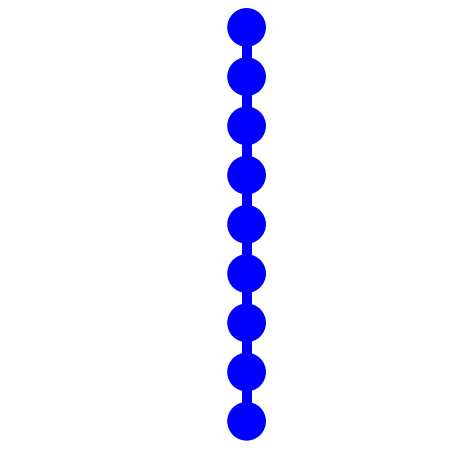
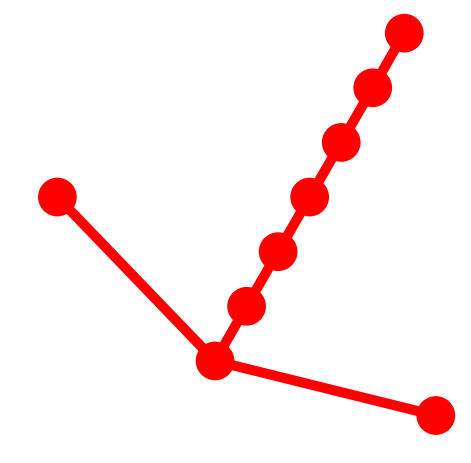
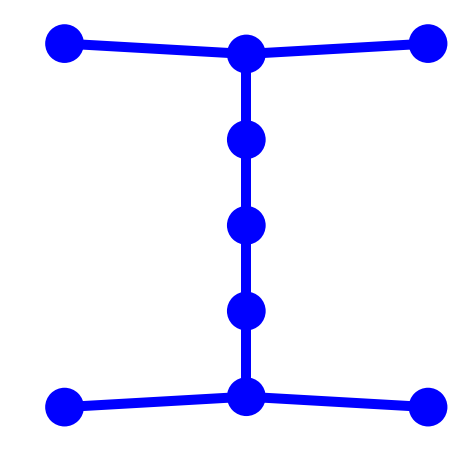
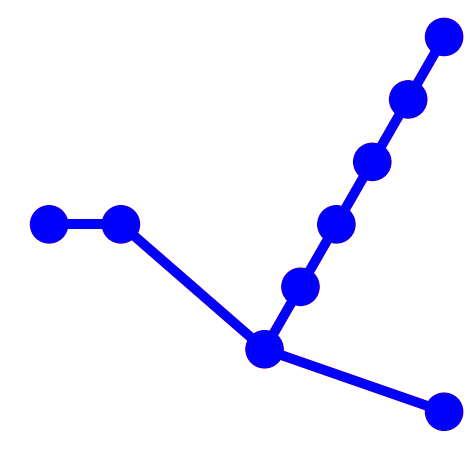
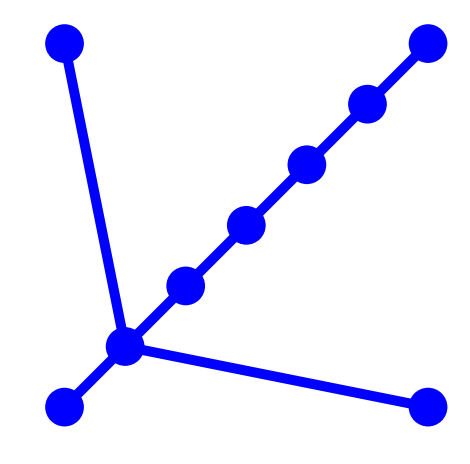
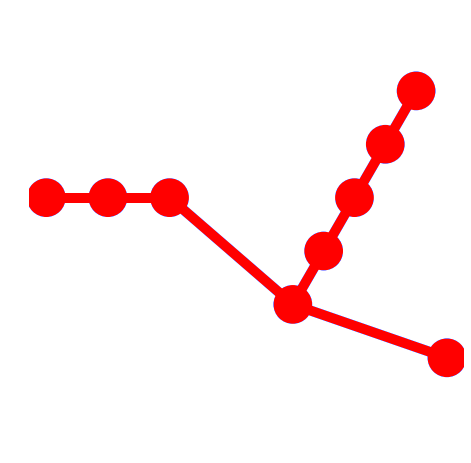
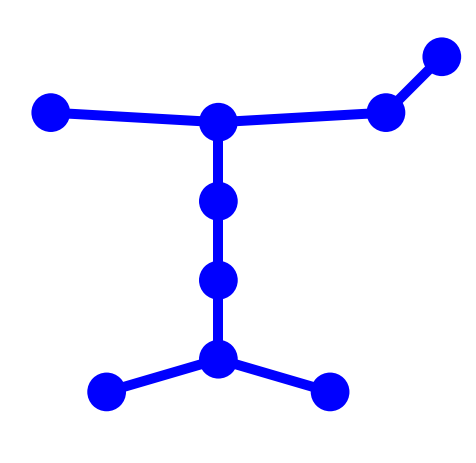
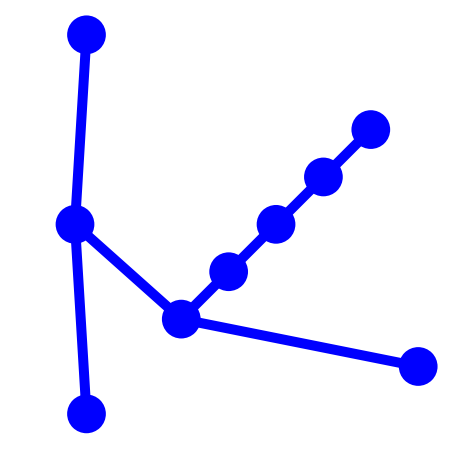
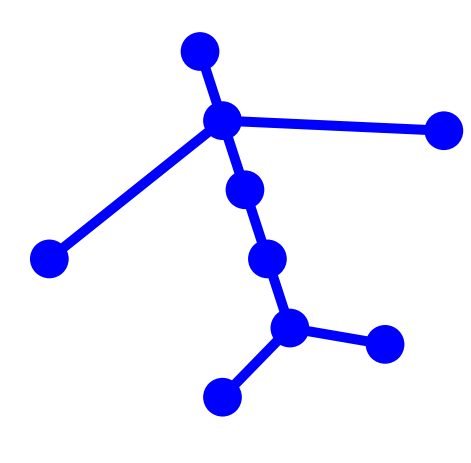
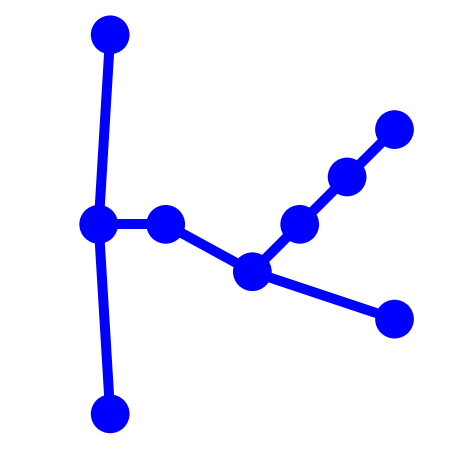
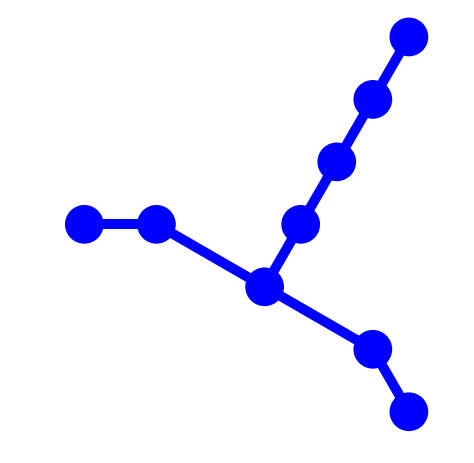
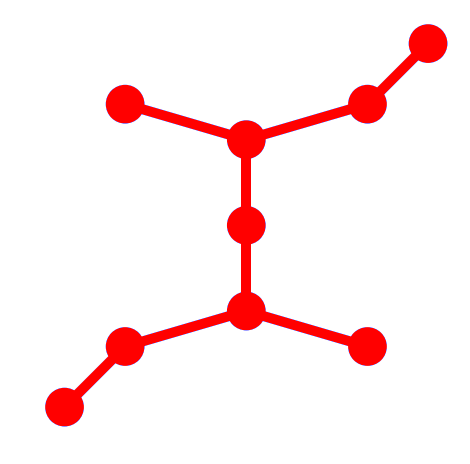
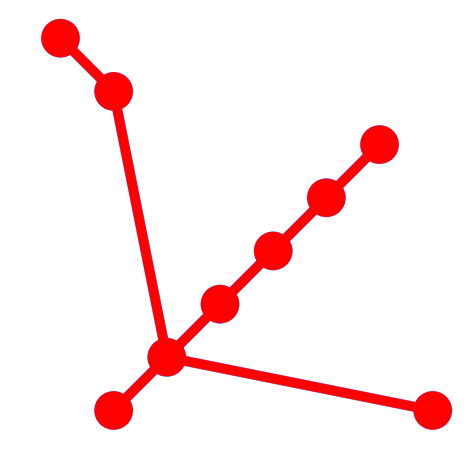
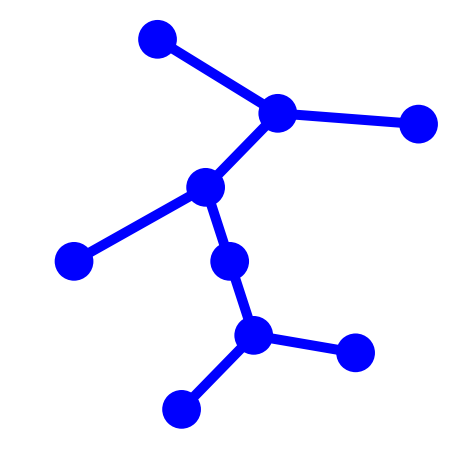
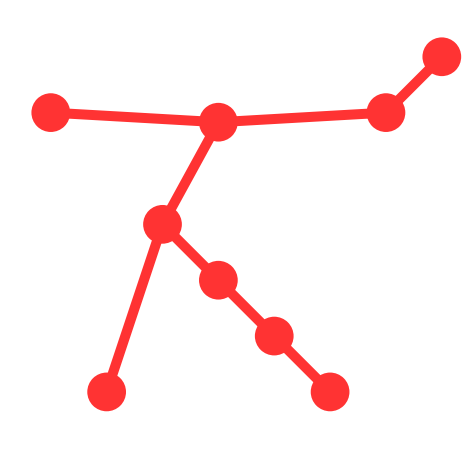
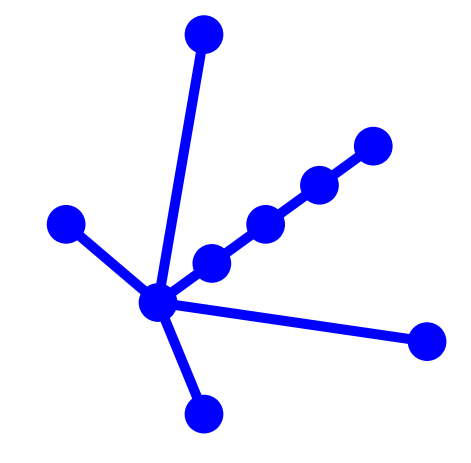
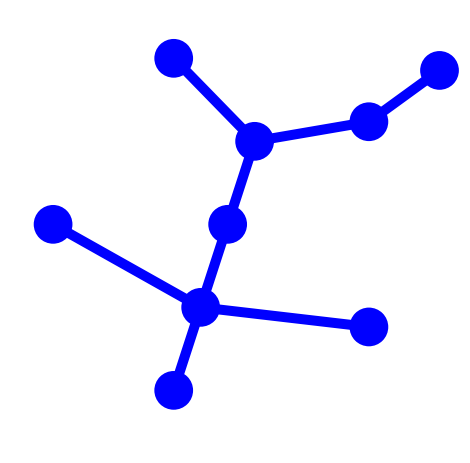
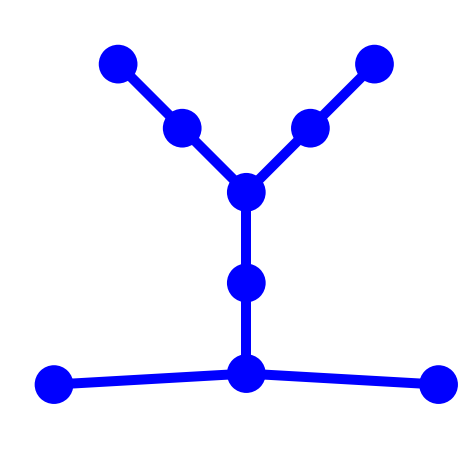
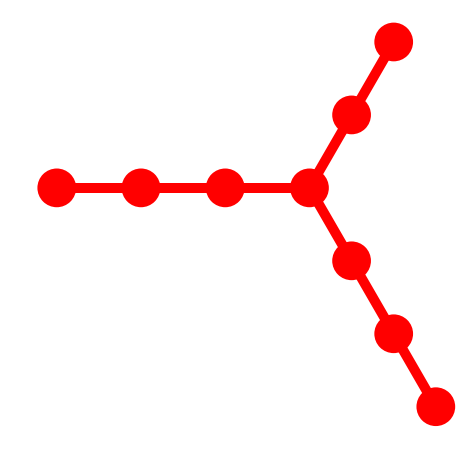
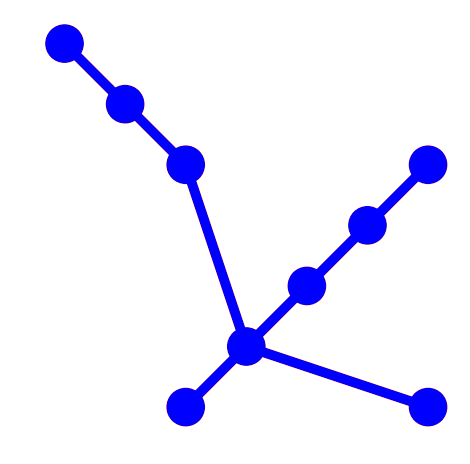
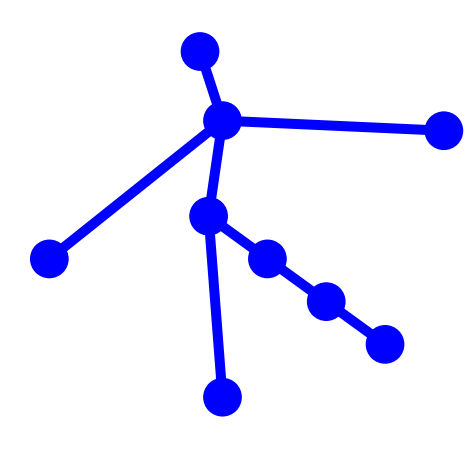
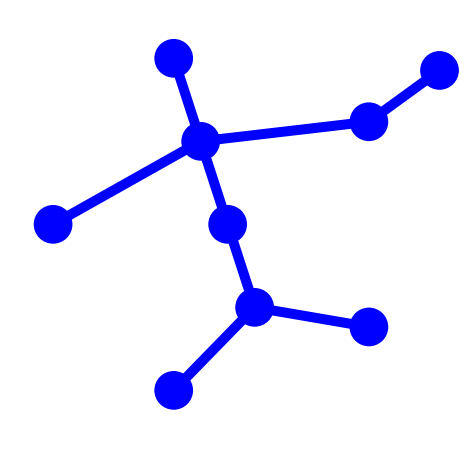
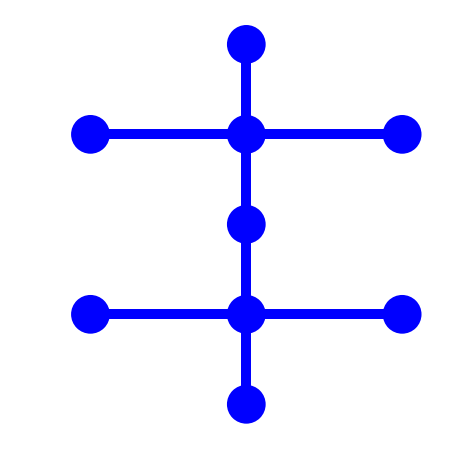
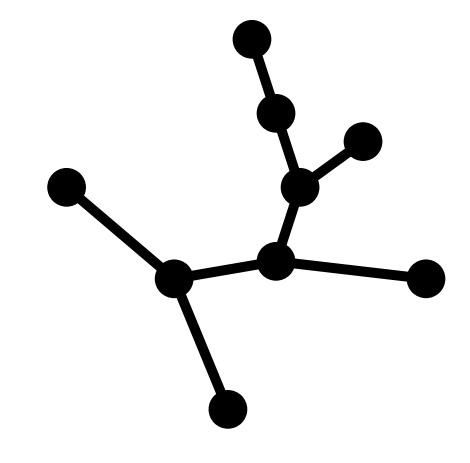
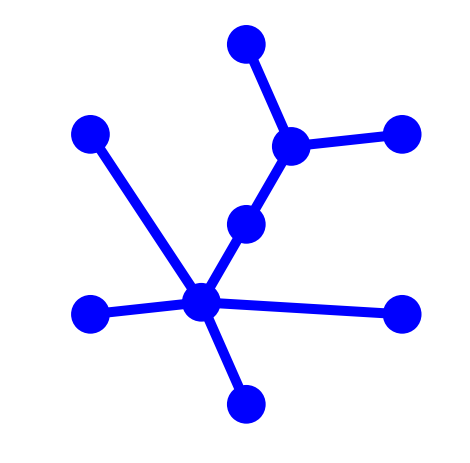
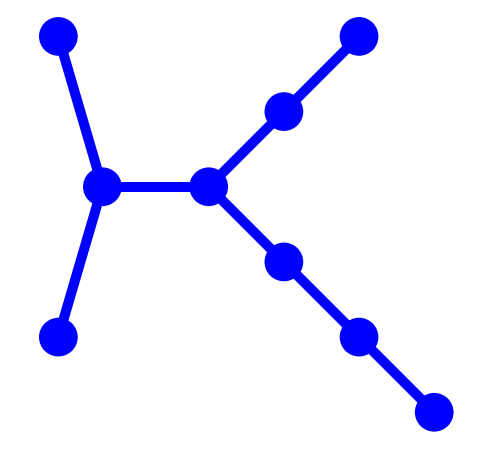
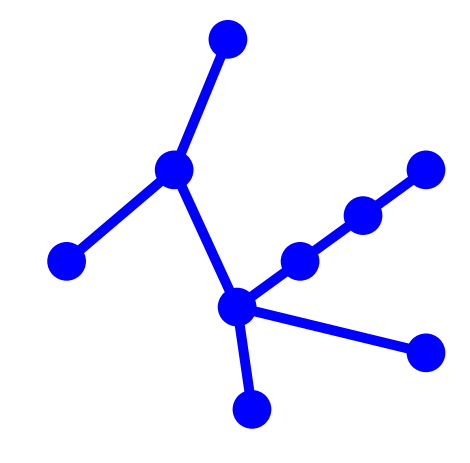
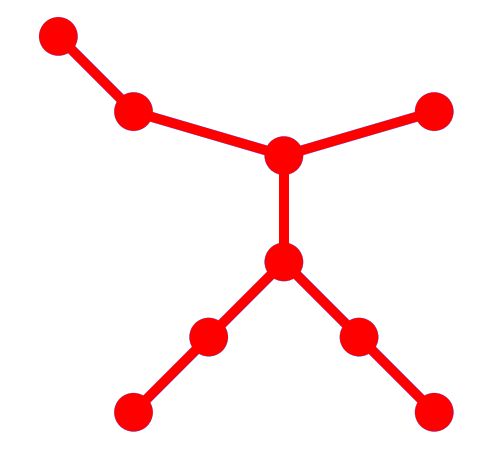
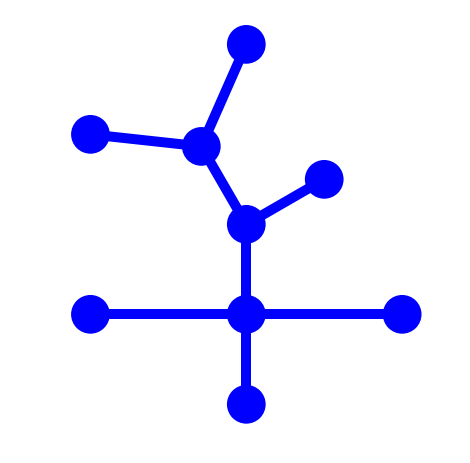
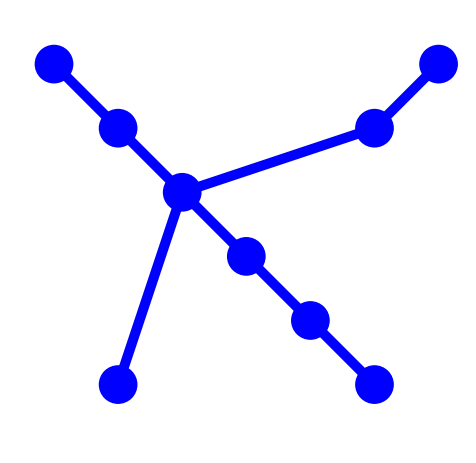
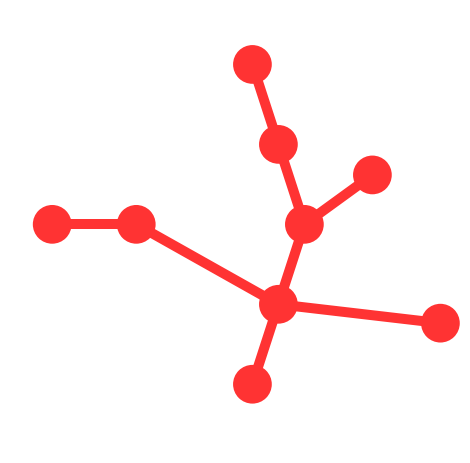
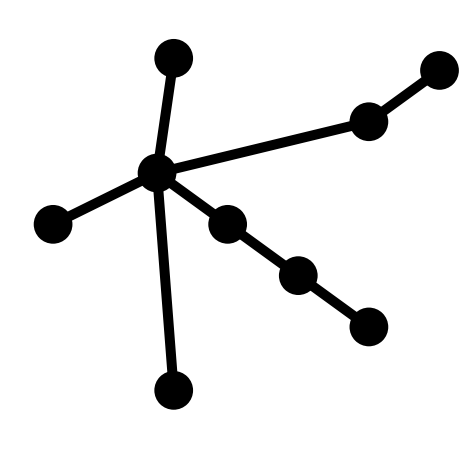
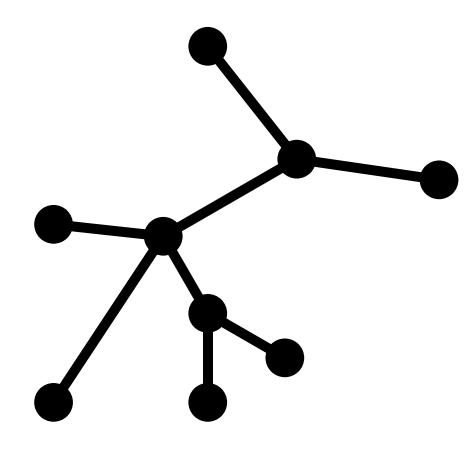
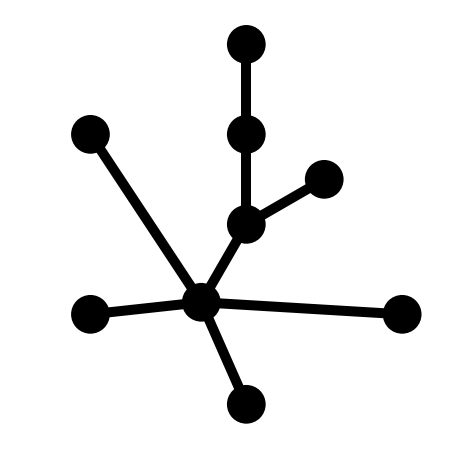
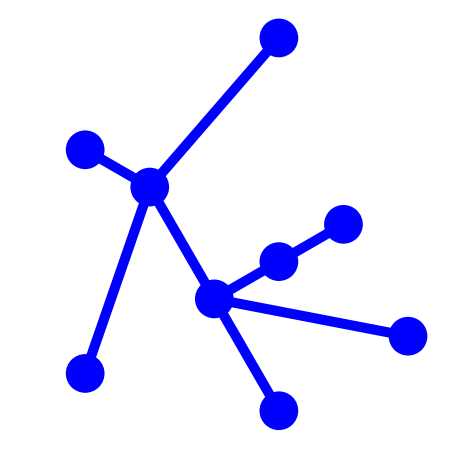
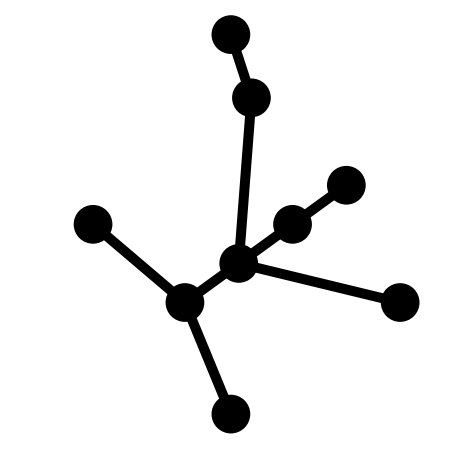
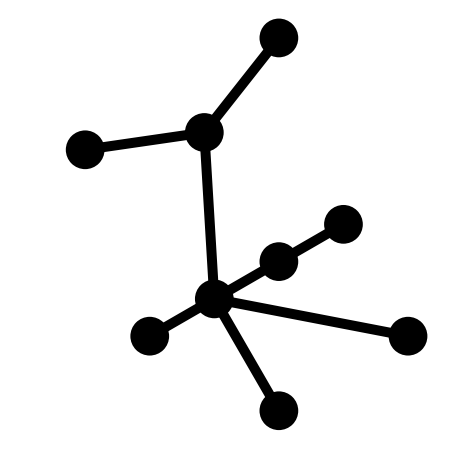
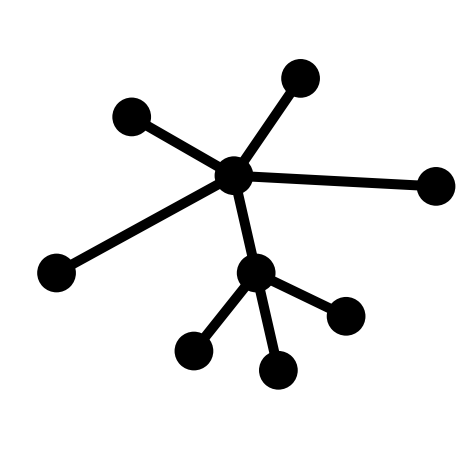
These graphs have been ordered according to the second smallest eigenvalue of their Laplacian matrix (λ2 is given).
**Please Note:
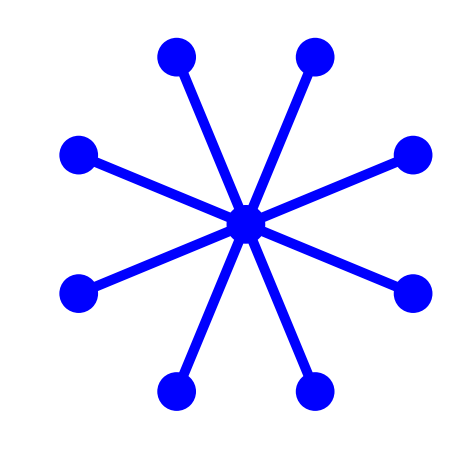
Red graphs symbolize topologies that have been discovered in naturally occurring structures, while blue and black graphs denote "missing motifs"
that have not yet been discovered in nature.
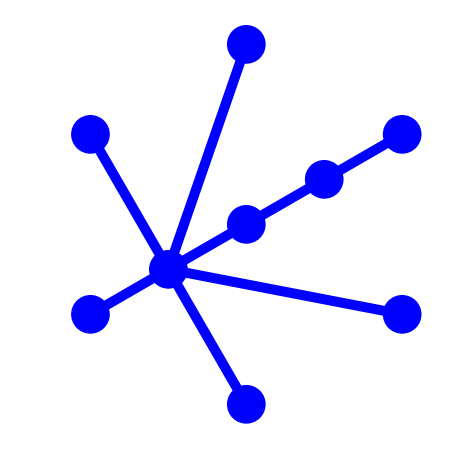
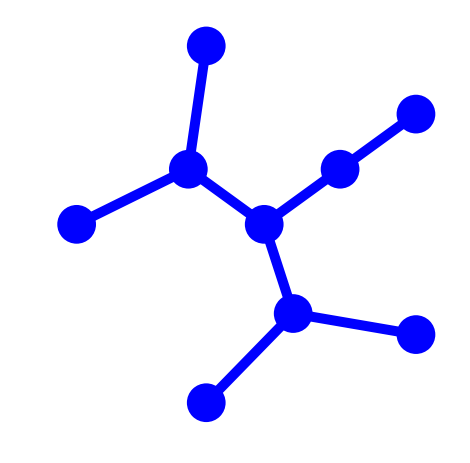
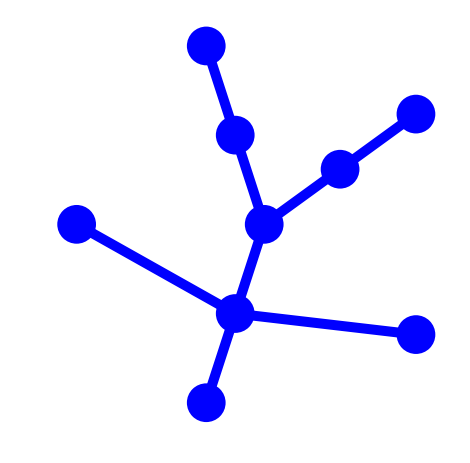
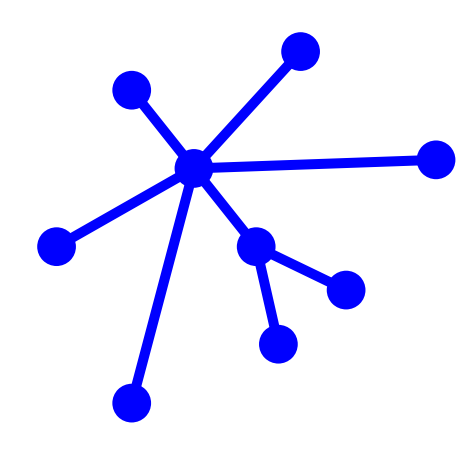
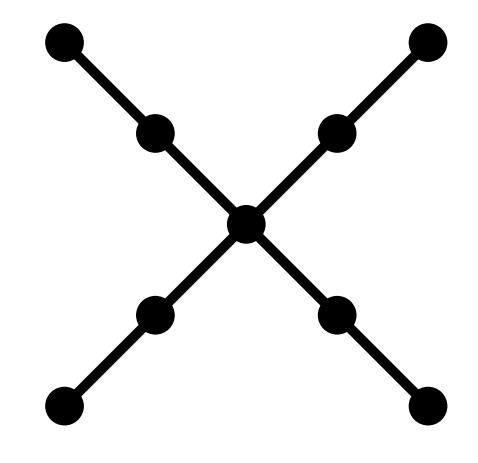
Missing motifs are subdivided into two categories: topologies predicted by k-NN clustering
to be RNA-like, or likely to be discovered in naturually occuring RNAs (blue graphs) and topologies predicted by k-NN clustering to be
non-RNA-like, or not expected to be found in nature (black graphs).
 = 0.1206147596 = 0.1206147596
| = 0.1288751066
| = 0.1391941458
|
| = 0.1404187828
| = 0.1487438530
| = 0.1505716443
|
| = 0.1538128853
| = 0.1626924723
| = 0.1649243534
|
| = 0.1657568216
| = 0.1708386093
| = 0.1729090810
|
| = 0.1774231046
| = 0.1830442697
| = 0.1862307191
|
| = 0.1876032054
| = 0.1883639395
| = 0.1952873915
|
| = 0.1980622560
| = 0.1980622560
| = 0.2022320032
|
| = 0.2042603046
| = 0.2087121457
| = 0.2117858529
|
| = 0.2201288640
| = 0.2216537148
| = 0.2232391983
|
| = 0.2310675234
| = 0.2377312034
| = 0.2397586107
|
| = 0.2427033633
| = 0.2482500970
| = 0.2650340199
|
| = 0.2679491937
| = 0.2679491937
| = 0.2679491937
|
| = 0.2679491937
| = 0.2824704349
| = 0.3046890795
|
| = 0.3157595992
| = 0.3271763027
| = 0.3571597934
|
| = 0.3819660246
| = 0.3819660246
| = 0.3819660246
|
| = 0.4427980781
| = 1.0000000000
|

Because the structures of the 5S rRNA database could not be located in 2010 and was produced using Mfold in 2004:
Tree (9,13) has been corrected from existing in (2004) to RNA-like in (2010)